
This post is a continuation of Code quality management - common problems & how to solve them, read that first for a general discussion of software code quality management and how SonarQube helps in the process.
SonarQube infrastructure
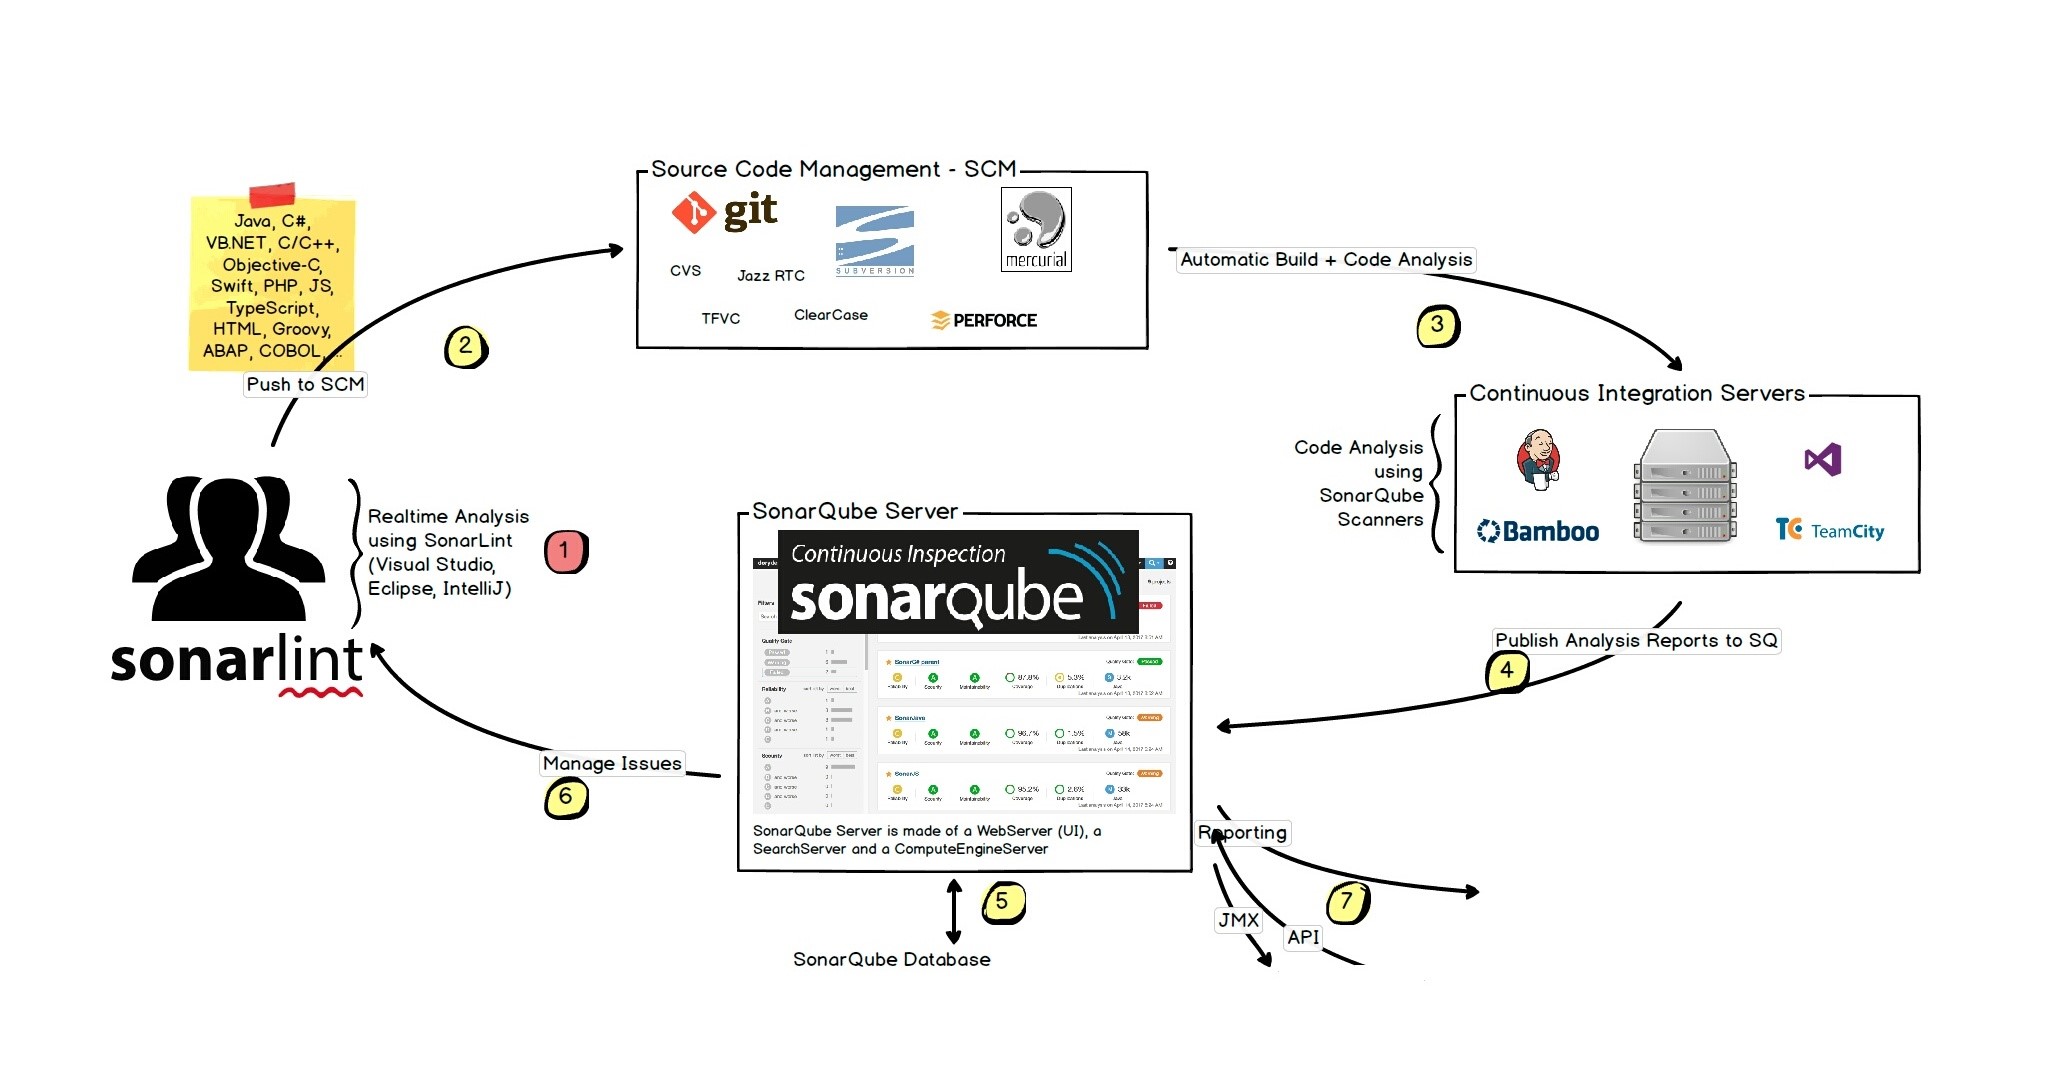
SonarQube needs three components to work, SonarQube server, SonarQube Scanner and language pugin(s)
- SonarQube Scanner - language/tech-stack aware scanner that actualy runs analysis on the code
- SonarQube Server - where data is sent back after analysis, the processed data is analysed further and reports, insights are created
- Language plugin - language specific plugin for the the server (e.g. SonarC#, SonarJava, SonarPython etc.), with language specific rules and behaviours. Some of the language plugins are installed on the server by default, while others can be installed separately. See all language plgins here.
SonarQube setup process for development
We’ll setup the infrastructure on a Windows system. They can be setup on Linux and macOS as well. We’ll run analysis on a .NET project, so we’ll use SonarC# (SonarVB is also available) plugin and MSBuild runner. Setting up and running for other languages and project types will have a similar but slightly different process.
[1] Install and run the SonarQube Server
- Download SonarQube here. I used the current “SonarQube 7.0”
- Extract the contents of the zip file to a directory with access (e.g.
C:\sonarqube) - Go inside
binfolder and find the correct directory as per the system (e.g.bin\windows-x86-64) - Run the
StartSonar.batbat file (double-click or run from command line) - It may take a few minutes to run. Once started successfully, it’ll show a message like “jvm 1 | 2018.03.08 17:01:12 INFO app[][o.s.a.SchedulerImpl] SonarQube is up”
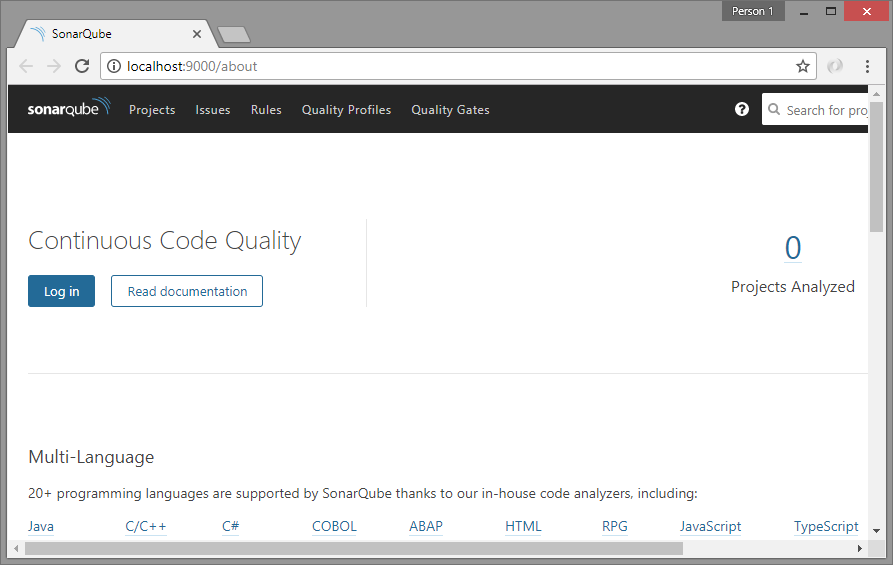
- Browse the user interface at http://localhost:9000
- You can login with default admin credentials
admin/adminto access admin tools - To stop the server, press
Ctrl + Con the command line window
Note: For SonarQube 7 you need to have Java 8 runtime installed on the system. Otherwise you’ll get an error like ” Unable to execute Java command. The system cannot find the file specified”. If not already installed, download and install JRE 8.
[2] Setup the C# plugin SonarC#
With current versions of SonarQube server, SonarC# is pre-installed. With my instance of SonarQube 7, came SonarC# 6.7.1. For VB projects, install the SonarVB plugin.
[3] Setup SonarQube Scanner for MSBuild
Once SonarQube server is setup & running, let’s install SonarQube Scanner on the machines where analysis will be performed. That means, the development machines if the developers want to run locally and the build machines where the build system will run the code analysis. We’ll use it for a .NET project, so we’ll use the SonarQube Scanner for MSBuild. Installation and setup guides for other project/build types (e.g. Maven, Gradle, Ant etc.) are available here.
- You should already have SonarQube 6.7+ and SonarC# 6.7+ (mine are 7 and 6.7.1 respectively) on SonarQube server
- On SonarQube Scanner machine - install .NET Framework 4.6+, Java runtime 8
- Download SonarQube Scanner for MSBuild. It’ll download a zip file “sonar-scanner-msbuild-{version}.zip”. I downloaded version 4.0.2.892
- Unblock the zip file (Right-click on file -> Properties -> Unblock)
- Unzip the “sonar-scanner-msbuild-{version}.zip” on to local directory, e.g. inside
C:\sonarqube\bin\scanner - Add the path
C:\sonarqube\bin\scannerto system environment variables. This path has the MSBuild scanner exe - Edit
SonarQube.Analysis.xmlto specify the following parameters:- sonar.host.url - URL to your SonarQube server, if not http://localhost:9000
- sonar.login - Analysis token of a user with Execute Analysis permissions. Required only if Anonymous access is not available
- If required, restrict access to SonarQube.Analysis.xml by setting appropriate file permissions
For production installation, see the system requirement and instructions. Also check out the available editions and pricing.
Running MSBuild Scanner for a project
Once all the above setup is completed successfully, we are ready to actually analyse our code and store details in SonarQube server.
Note: We should create separate SonarQube project for each of our codebase, and everytime the analysis reports should be sent to same project for historical analysis. So, while running following commands, the project key (which uniquely identifies a SonarQube project) and project display name (optional, used for display on SonarQube UI) should ke kept constant throughout the lifetime of the codebase.
Now we’ll run analysis against our code, and upload results to our SonarQube project. For that go to the desired project (code) directory and run the following 3 commands in sequence. Ideally, the 3 commands should be saved in a .bat file in project folder, and run from there.
# begin analysis - prepare for the analysis
# syntax: SonarQube.Scanner.MSBuild.exe begin /k:"unique-project-key" /n:"project-display-name" /v:"project-version"
# mention server uri IF NOT https://myserver.com:9000, /d:sonar.host.url=https://myserver.com
SonarQube.Scanner.MSBuild.exe begin /k:"myproject" /n:"My Project" /v:"1.0"
# build the project/solution
msbuild SolutionName.sln /t:rebuild
# end analysis - this will load data to server and do more analysis!
SonarQube.Scanner.MSBuild.exe end
Tip: For the end analysis command, it’ll try to fetch blame data from the source control (Git & SVN are pre-configured). If your source control needs a VPN or proxy, set them up before running the end command.
Tip: To run msbuild command from any location, add the path of MSBuild.exe to the system environment variables. For example, the MSBuild version 15 that comes with Visual Studio 2017, can be found at “C:\Program Files (x86)\Microsoft Visual Studio\2017\{Edition}\MSBuild\15.0\Bin”.
The process can take quite a while (the end command) for the first-time use. While it took around 2 minutes to process a codebase of ~20k lines, for another codebase of ~125k lines (that includes ~55k lines C# source code, and rest in JavaScript code & libraries, XML files etc.), it took almost 30min to process completely. But that time also inludes scanning SVN for blame data over VPN network. In the process, it’ll create a new folder .sonarqube inside current folder, to write all details. And after the scanner has completed the work, the server may need some more time to process and show updated results.
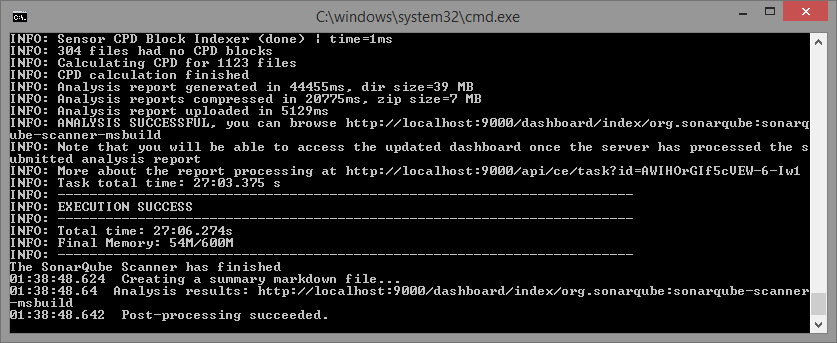
We can now go the the project in SonarQube interface and see the details of the analysis.


Detailed analysis with SonarQube
Apart from static code analysis (code smlls, bugs, lines of code, complexity, duplication etc.), SonarQube is also very useful for things like unit testing, code coverage analysis, issue trends etc. Practically, SonarQube does not do all these by itself, it just uses standard tools like NUnit, OpenCover and others, but includes the results into the aggregated analysis and provides more details like historical analysis, leak period analysis etc.

Following is a sample script that runs unit tests & code coverage apart from static code analysis. It creates a directory TestOutputs and dumps NUnit & OpenCover results in that, and then sends analytics to the SonarQube server. See NUnit and OpenCover documentations for their specific syntax and options.
@echo off

REM # Remove output directory
IF EXIST "TestOutputs" RD /S /Q TestOutputs

REM # (re)create output directory
MD TestOutputs

REM # begin analysis - prepare for the analysis
REM # specify unit test results & opencover coverage reports
SonarQube.Scanner.MSBuild.exe begin /k:"myproject" /n:"My Project" /v:"1.0" /d:sonar.cs.nunit.reportsPaths="TestOutputs\NUnitResults.xml" /d:sonar.cs.opencover.reportsPaths="TestOutputs\opencover.xml"

REM # build the project/solution
msbuild MySolution.sln /t:rebuild /p:OutputPath=BuildOutput

REM # run NUnit tests
"C:\Program Files (x86)\NUnit 2.6.4\bin\nunit-console.exe" /result=TestOutputs\NUnitResults.xml BuildOutput\MyProject.CoreTests.dll BuildOutput\MyProject.Data.Tests.dll BuildOutput\UIModules.ServicesTests.dll BuildOutput\UIModules.Web.Tests.dll

REM # run OpenCover coverage, use filters to include/exclude dlls
"C:\Users\Me\AppData\Local\Apps\OpenCover\OpenCover.Console.exe" -register:user "-target:C:\Program Files (x86)\NUnit 2.6.4\bin\nunit-console.exe" "-targetargs:BuildOutput\MyProject.CoreTests.dll BuildOutput\MyProject.Data.Tests.dll BuildOutput\UIModules.ServicesTests.dll BuildOutput\UIModules.Web.Tests.dll /noshadow" "-output:TestOutputs\opencover.xml" "-filter:+[MyProject*]* +[My.Shared*]* +[UIModules*]* -[*Tests]* -[*.Console]* -[*Models]*"

REM # process end analysis
SonarQube.Scanner.MSBuild.exe end

REM # keep window open
pause
Tip: You can use OpenCover filters to selectively include or exclude specific assemblies and classes from coverage analysis.
Tip: To exclude some modules/classes from code coverage/source code analysis in SonarQube, you can narrow down analysis scope with Ignore Patterns.
SonarLint code analysis for Visual Studio
The simplest way to use SonarQube code analysis at development time is to add SonarQube extension SonarLint to Visual Studio (currently available for VS 2015 and 2017). To install
- Open Visual Studio
- Go to >
Tools>Extensions & updates... - Go to
Onlineleft menu, search for “sonarlint” - Click “Download”. The extension will install after VS restart. I installed current latest version
3.10.0.3095
Once installed, it’ll show code analysis details as you code
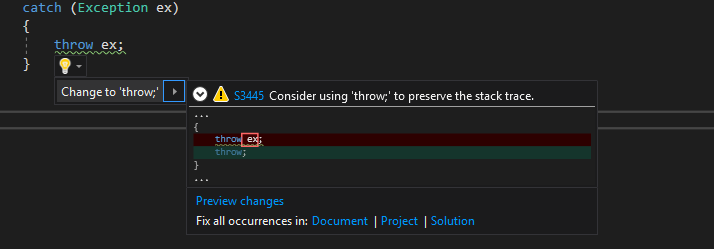
You can click on the rule-id link to go to the rule details/help page. Actually this squiggly lines for error/warning or the bulb-tips are already part of the Visual Studio infrastructure, SonarLint basically integrates it’s rule-set with the VS in-built rules.
Note: As of March 2018, SonarLint DOES NOT support .NET Core project. This feature is currently under test and hopefully, it will be available soon. On the other hand, SonarQube Scanner for MSBuild 2.3 DOES support .NET Core projects.
Bonus read
Another good practice is to run code analysis on each Visual Studio build, so that you get to know the code quality on build and compare with previous state for progress. Once setup properly, Visual Studio will show code analysis results in the Error List bottom tab of the editor. This is not enabled by default, we have to enable it for projects which we want to analyse on build.
To enable SonarLint code analysis on build for a project
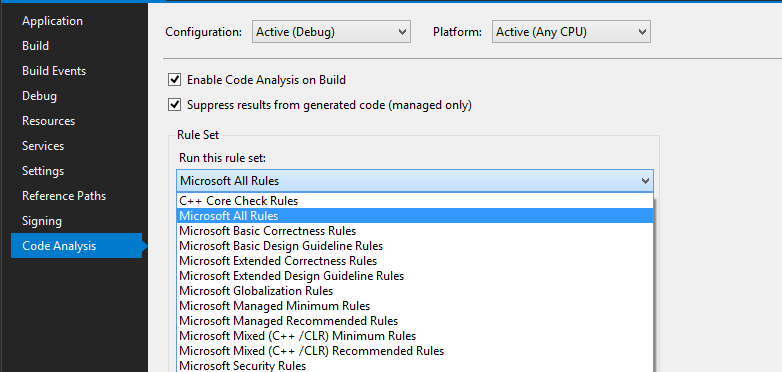
- Enable code analysis on build for the project » Right-click on project and go to
Properties» SelectCode Analysison left menu » Check the “Enable Code Analysis on Build” option, and save. - Enable SonarQube rules » Expand project references, right-click “Analysers” and select “Open Active Rule Set” OR, On
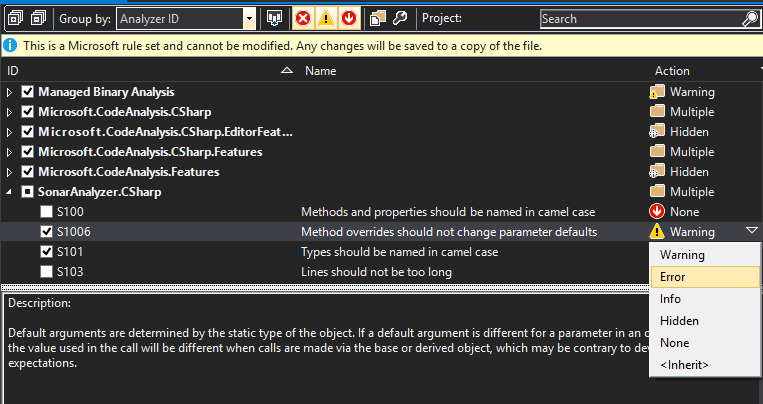
Code Analysisleft menu from above, select “Microsoft All Rules” and “Open” » Select the rules you want (or leave with default selection)
You can change action level if required (e.g. Warning to Error) - if you make any change, they get saved in the project folder as ProjectName.ruleset XML file
Notice that the code analysis settings are saved in the project.csproj, inside a PropertyGroup
<PropertyGroup Condition=" '$(Configuration)|$(Platform)' == 'Debug|AnyCPU' ">
    ...
    <CodeAnalysisRuleSet>AllRules.ruleset</CodeAnalysisRuleSet>
    <RunCodeAnalysis>true</RunCodeAnalysis>
</PropertyGroup>
SonarQube (or SonarLint) comes with a strong set of rule set. But, if you really need, you can customize own rules with the SonarQube Roslyn SDK. The source code for current set of rules are available here.
References
- SonarQube - continuous code quality
- SonarC# - home, docs, GitHub codebase, rules
- SonarLint for Visual Studio, Linking SonarLint with remote SonarQube
- Setups - SonarQube, plugins
- SonarQube Scanner for MSBuild - setup, configuration
- MSBuild - docs, commandline reference